🎧 New episode of Care, Code, & Capital - Listen to Grit, Recovery, and AI Trailblazing in Healthcare 🎧


Clinical
Now Live: Psychotropics & Clinical Indicators Dashboards
May 8, 2026
8min
Clinical leaders are asking the same question: “How are we doing on psychotropics right now?”
For most skilled nursing facilities (SNFs), answering that is a painful, manual lift—digging through physician orders in PCC or another EHR, exporting spreadsheets, and trying to piece together a story that feels accurate and survey-ready.
That’s exactly why we built two new dashboards inside the Megadata Clinical Module:
- Psychotropics Dashboard
- Clinical Indicators Dashboard
Both are live today for clinical module customers.
This post gives you a deeper, practical walk-through of how they work, how they differ from CMS quality measures, and how corporate and regional clinical leaders can use them to strengthen oversight, support facility DONs, and prepare for survey.
Why we built these dashboards
From conversations with our users, two themes kept coming up:
- Psychotropics are a top survey risk.
Tracking psychotropic use across multiple facilities—by resident, by drug class, by indication—is incredibly difficult to do from the EHR alone. Every organization wants to know where they stand on psychotropics, but getting a clear answer is time-consuming and inconsistent.
- Clinical teams need real-time, EHR-based indicators—not just MDS data.
CMS quality measures (QMs) are based on MDS (Minimum Data Set) assessments, which means they’re always a step behind what’s actually happening on the unit. We heard loud and clear that clinical leaders want a current view of key indicators, pulled directly from their EHR (Electronic Health Record), to anticipate where their QMs and survey risk may be heading.
So we built dashboards that:
- Pull from real-time EHR data (e.g., physician orders and vitals in PCC)
- Provide regional roll-ups and facility-level drill-downs
- Make it easy to export, share, and discuss in daily, weekly, and monthly clinical meetings
Psychotropics Dashboard: From regional overview to resident-level detail
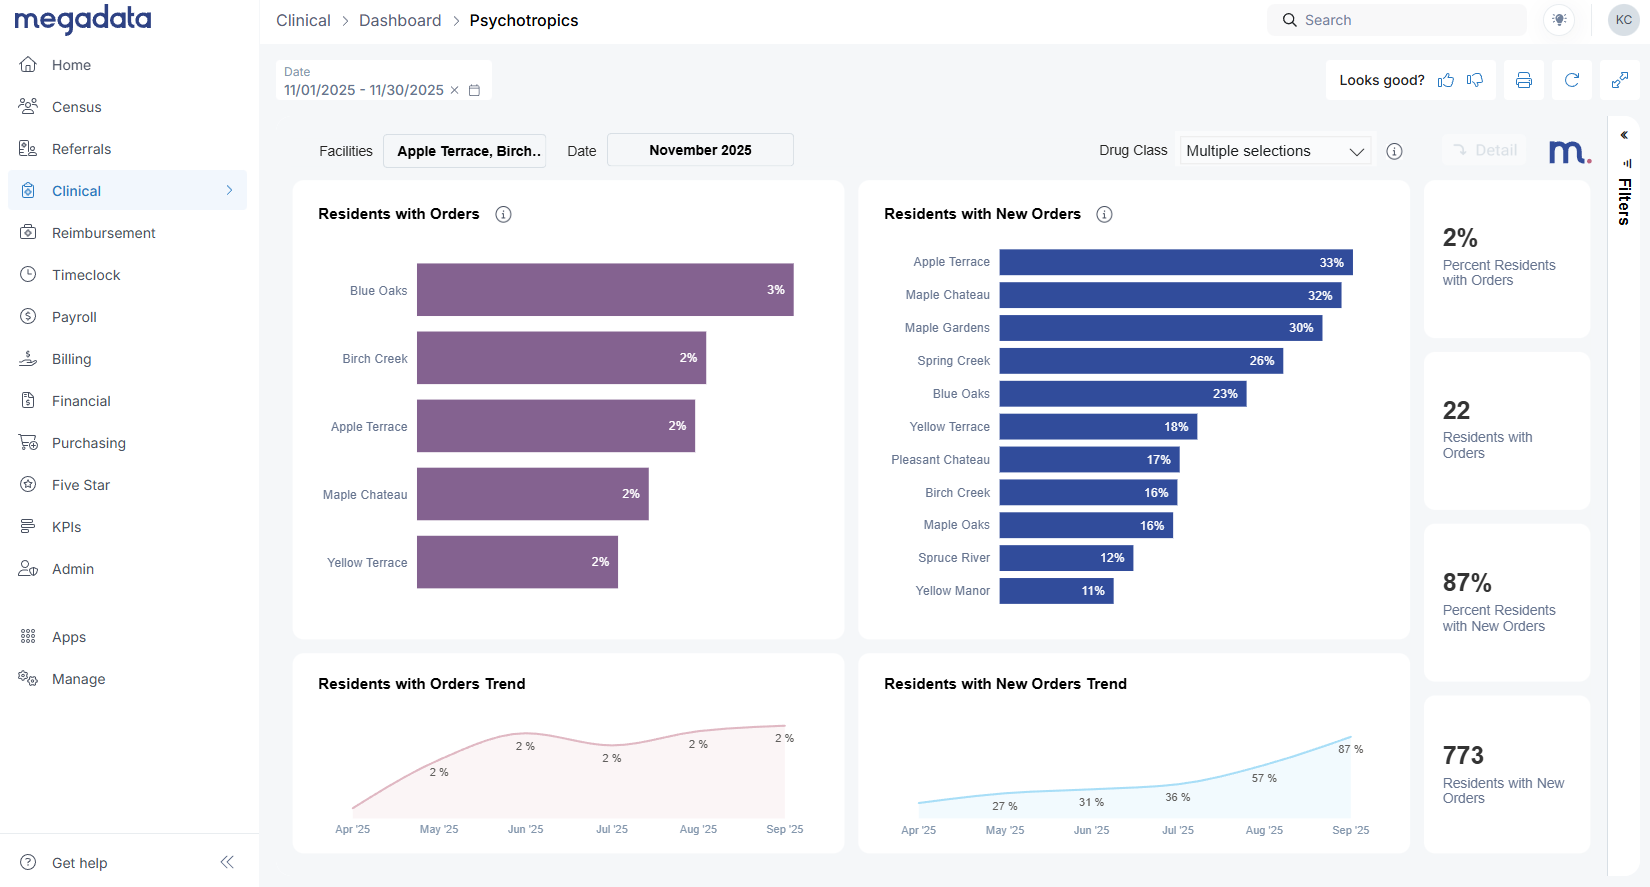
You’ll find the Psychotropics Dashboard under the Clinical tab in Megadata. For organizations with multiple facilities, the first view is designed for regional and corporate leaders.
Here’s what you can do on the multi-facility view:
- Select your date period (for example, last month)
- Compare facilities on:
- Residents with psychotropic orders during the period
- Residents with any new psychotropic orders during the period
- Click a facility (e.g., “Apple Terrace”) to see its trend over time for new orders or active orders
This view helps you quickly answer questions like:
- “Which buildings are seeing an uptick in new psychotropic orders?”
- “Where do I need to focus coaching or deeper review this month?”
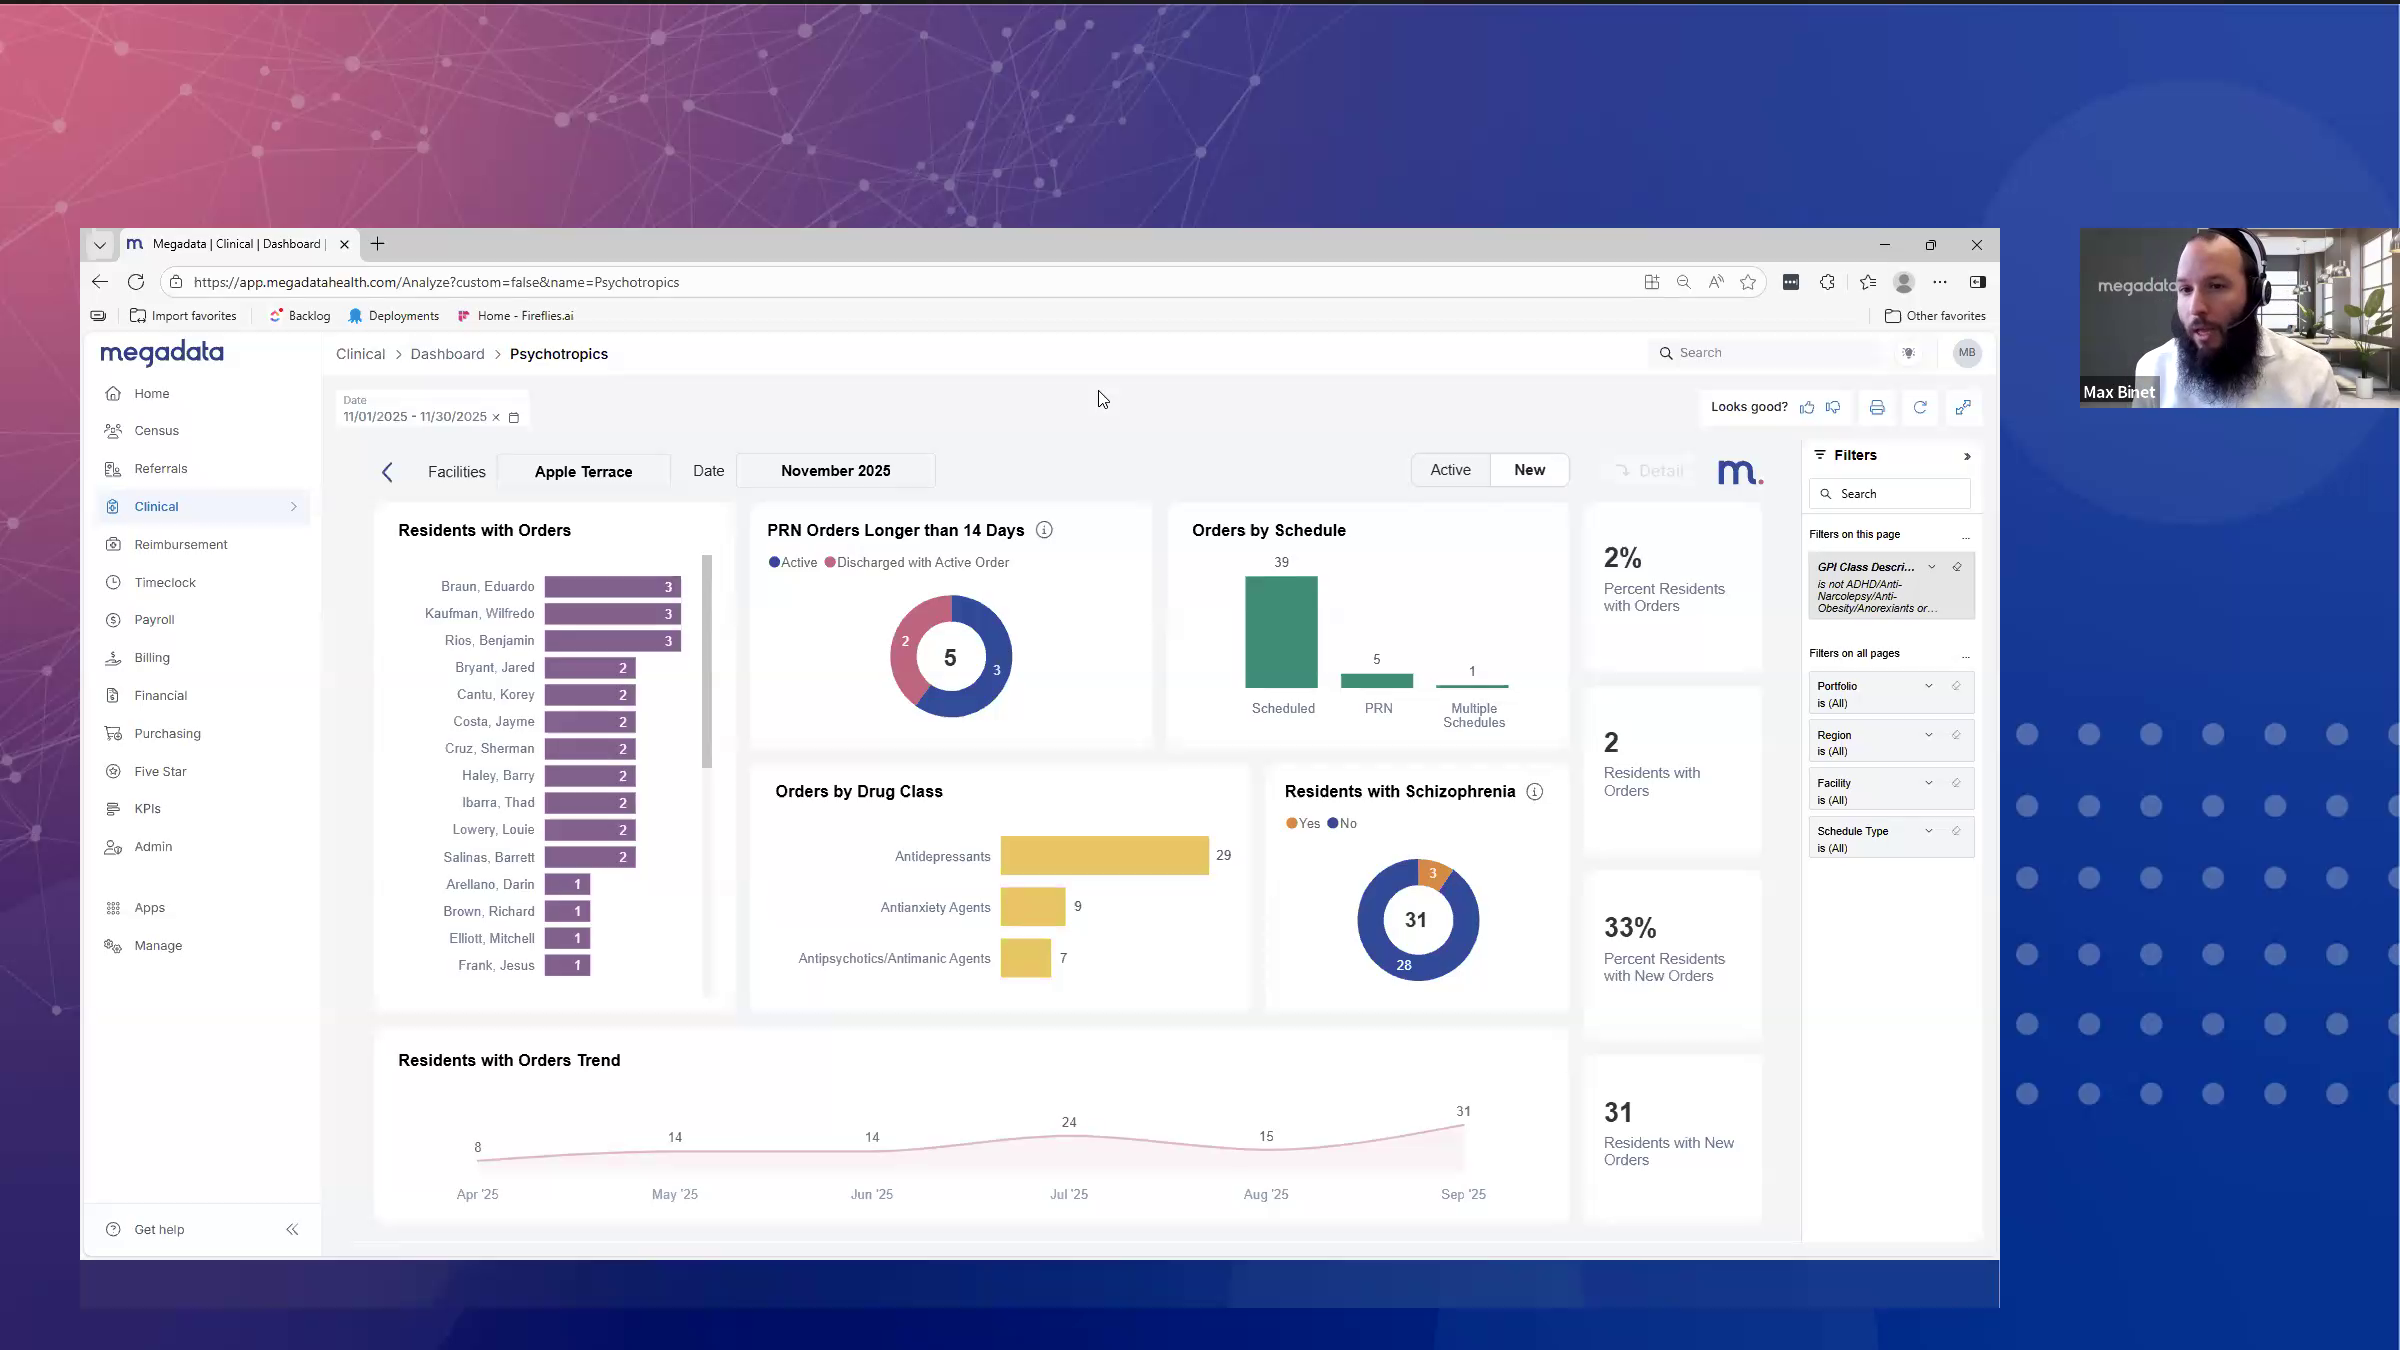
When you’re ready to dive deeper into a single facility, simply click that facility and then hit the Detail button in the upper right.
Facility detail: New vs active psychotropic orders
The facility detail page is where clinical leaders and DONs will likely spend most of their time.
Here, we make a clear distinction between:
- New Orders – Orders that were created during the selected month.
- Active Orders – Any orders where the resident was on a psychotropic at any point during the month, even if the order started earlier or was later discontinued.
Active orders will almost always be higher than new orders, since they capture ongoing treatment. This aligns with how CMS quality metrics think in terms of distinct residents, not just census.
From this view you can:
- See which residents received new psychotropic orders in the period
- Identify residents with multiple psychotropic orders
- Monitor overall trends for residents with orders or new orders month over month
Priorities in one glance: PRN >14 days and antipsychotic focus
The Psychotropics Dashboard highlights several higher-risk patterns that Max walked through in the webinar:
- PRN orders longer than 14 days
Facilities are strongly encouraged to avoid PRN (as-needed) psychotropic orders running longer than 14 days. The dashboard shows:- How many PRN psychotropic orders exceeded 14 days during the period
- How many of those are still active today
- Which residents are on those orders
- Discharged residents with active orders
The dashboard also surfaces residents who have been discharged but still show active psychotropic orders in the EHR.
These represent clean-up items that might otherwise be missed and can be addressed before they become a survey finding. - Orders by schedule and drug class
You can break orders down by:- Schedule (PRN vs scheduled)
- Drug class, with a specific focus on antipsychotics, which are heavily regulated and closely watched by surveyors.
When you click on antipsychotics, the whole page filters to show:
- The number of new antipsychotic orders given in the month
- The number of distinct residents involved
- How many of those residents do or do not have a documented schizophrenia diagnosis
That last piece is crucial. The dashboard clearly shows schizophrenia vs non-schizophrenia residents on antipsychotics, giving you a quick way to focus on potential compliance risk.
Order-level detail and export for QAPI
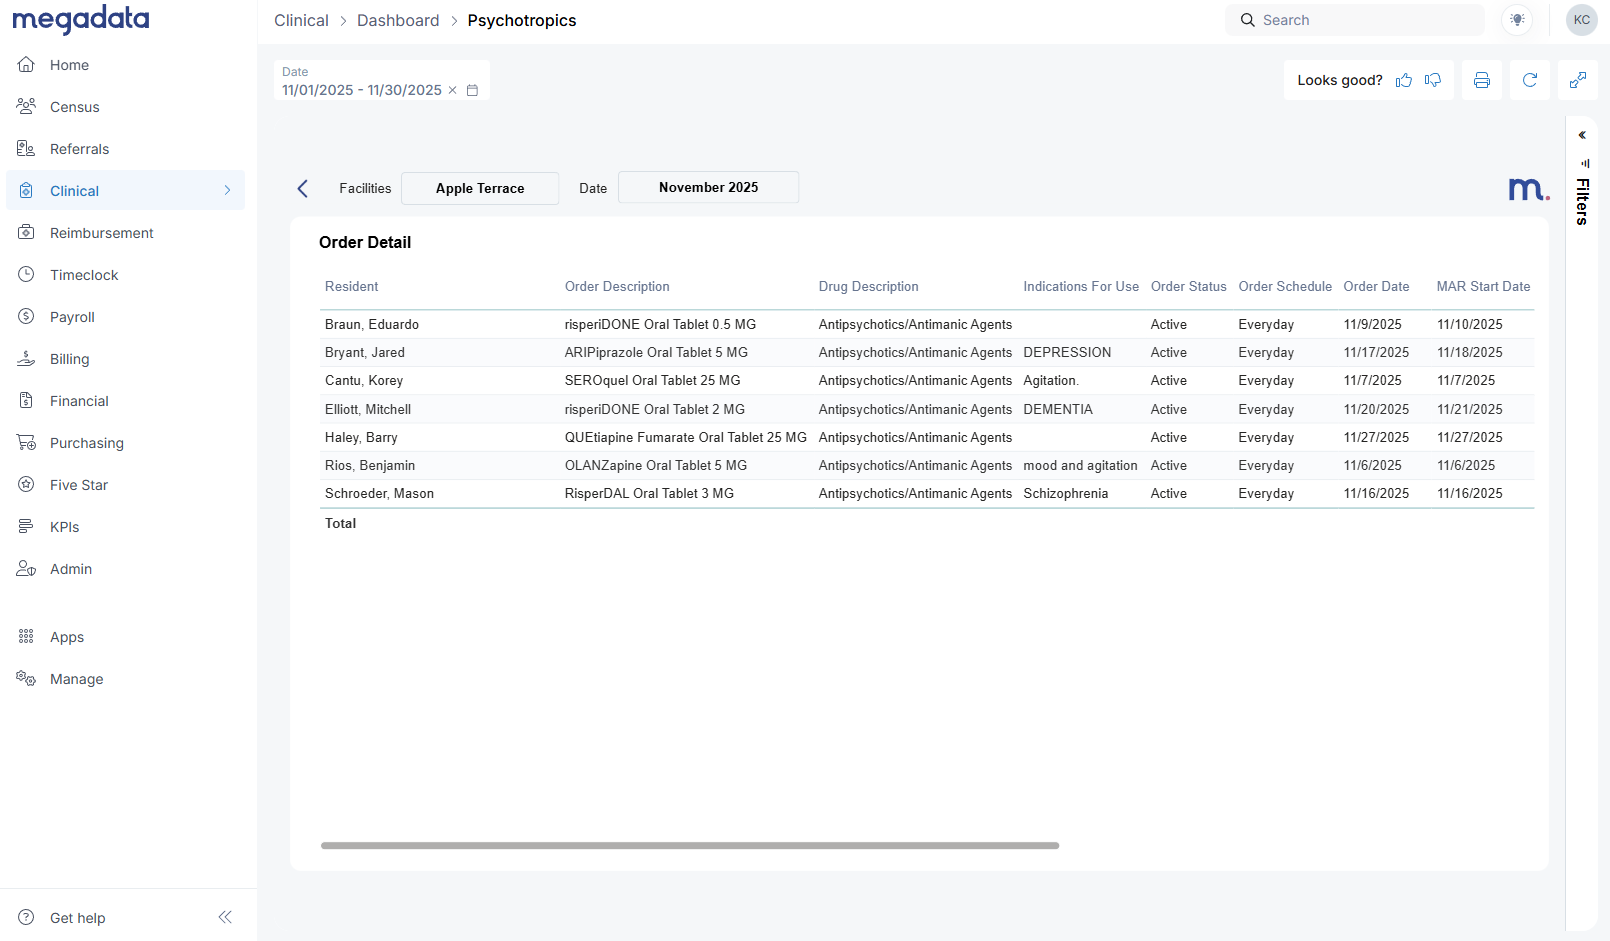
From the facility detail view, the Detail button opens a table that mirrors your physician orders in PCC:
- Resident name
- Order description
- Drug description
- Indication for use
- Order status (active, discontinued)
- Start/end dates
- Schizophrenia flag
- Ordering physician
- Order created by
Clinical leaders frequently asked: “Can I export this for my meetings?”
Yes. The three dots in the top right of the table open Export data, giving you an Excel file for:
- Daily morning huddles
- Weekly or monthly QAPI meetings (Quality Assurance and Performance Improvement)
- Sharing specific resident lists with facility teams
This is version 1 of the Psychotropics Dashboard, and we’re already gathering feedback to shape version 2, planned for 2026. We know areas like Gradual Dose Reduction (GDR) analytics are top of mind, and we’re actively listening to how different organizations are tracking that today.
Clinical Indicators Dashboard: A real-time lens on clinical performance
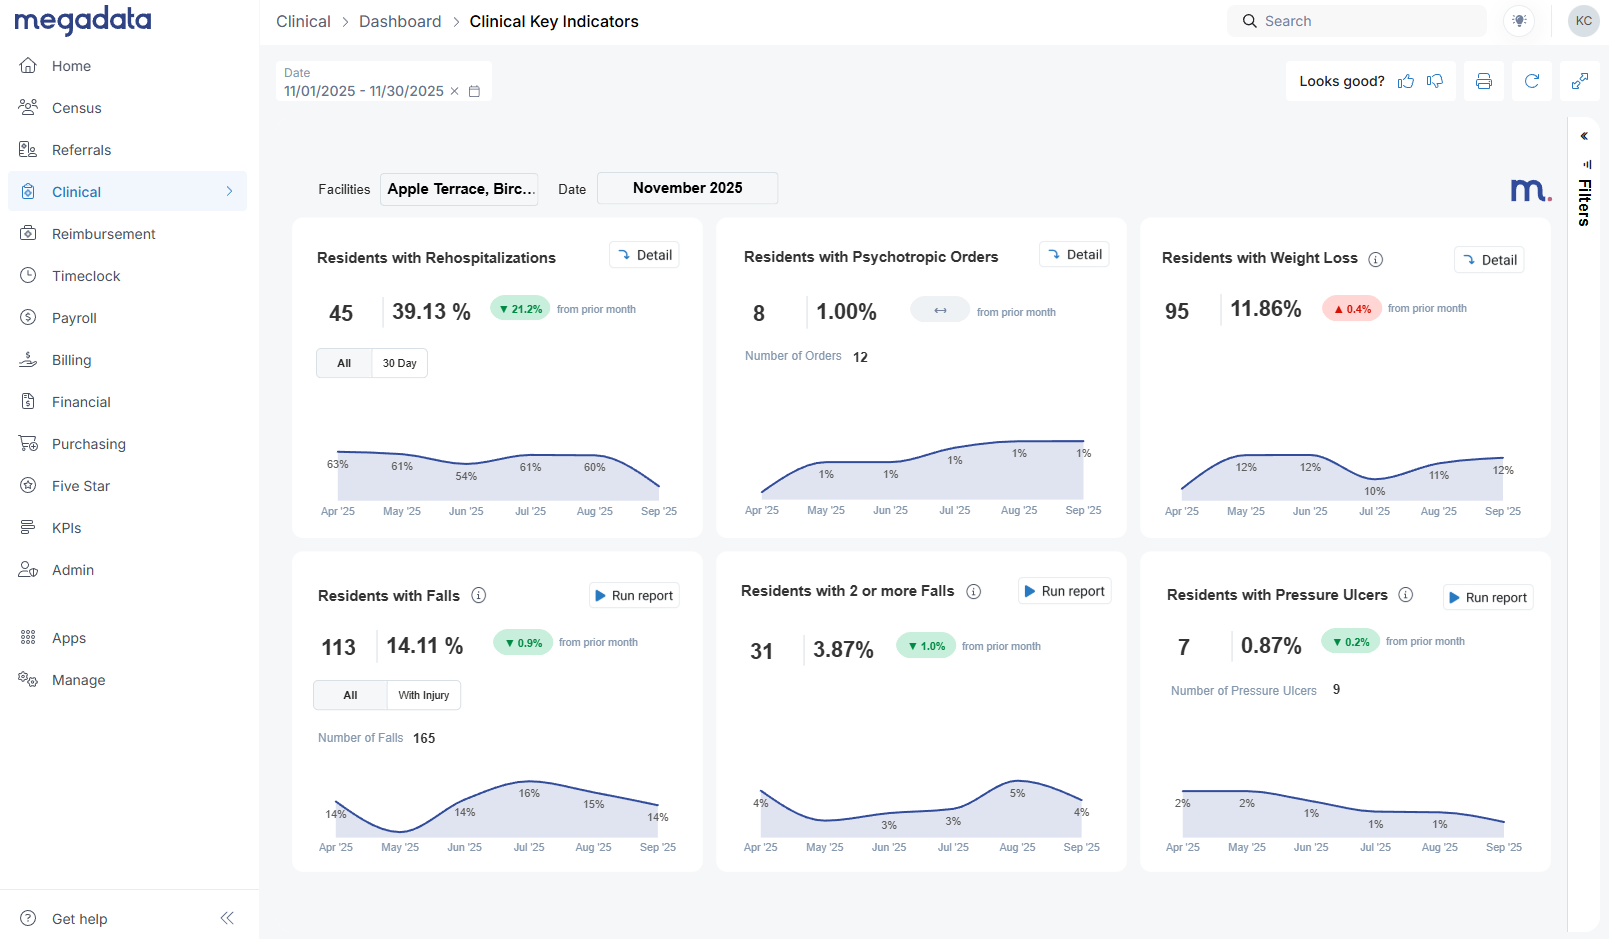
The Clinical Indicators Dashboard also lives under the Clinical tab. At first glance, it might look similar to CMS quality measures—but it behaves very differently.
Key point:
Our data comes directly from your EHR, not from MDS assessments.
- CMS QMs = based on MDS submissions
- Megadata Clinical Indicators = based on real-time EHR entries (e.g., vitals, physician orders, incident reports, wounds)
That means you won’t see the same numbers CMS shows, and they aren’t meant to match. Instead, this dashboard gives you an early, EHR-driven picture of how your clinical performance is trending.
Across the top, you’ll see tiles such as:
- Residents with rehospitalizations
- Residents with psychotropic orders
- Residents with weight loss
Each tile shows:
- Current period performance (e.g., this month)
- Comparison to prior month (improvement or worsening)
Along the bottom row, you’ll see indicators like:
- Residents with falls (all falls vs falls with injury)
- Residents with multiple falls
- Residents with pressure ulcers, based on your wounds integration (facility-acquired, stage 2+ and above)
Weight loss logic: Avoiding double counting
Weight loss is a great example of how we try to mirror how CMS thinks while working realistically with EHR data.
Currently, we flag residents who meet either:
- 5% loss within 30 days, or
- 10% loss within 180 days
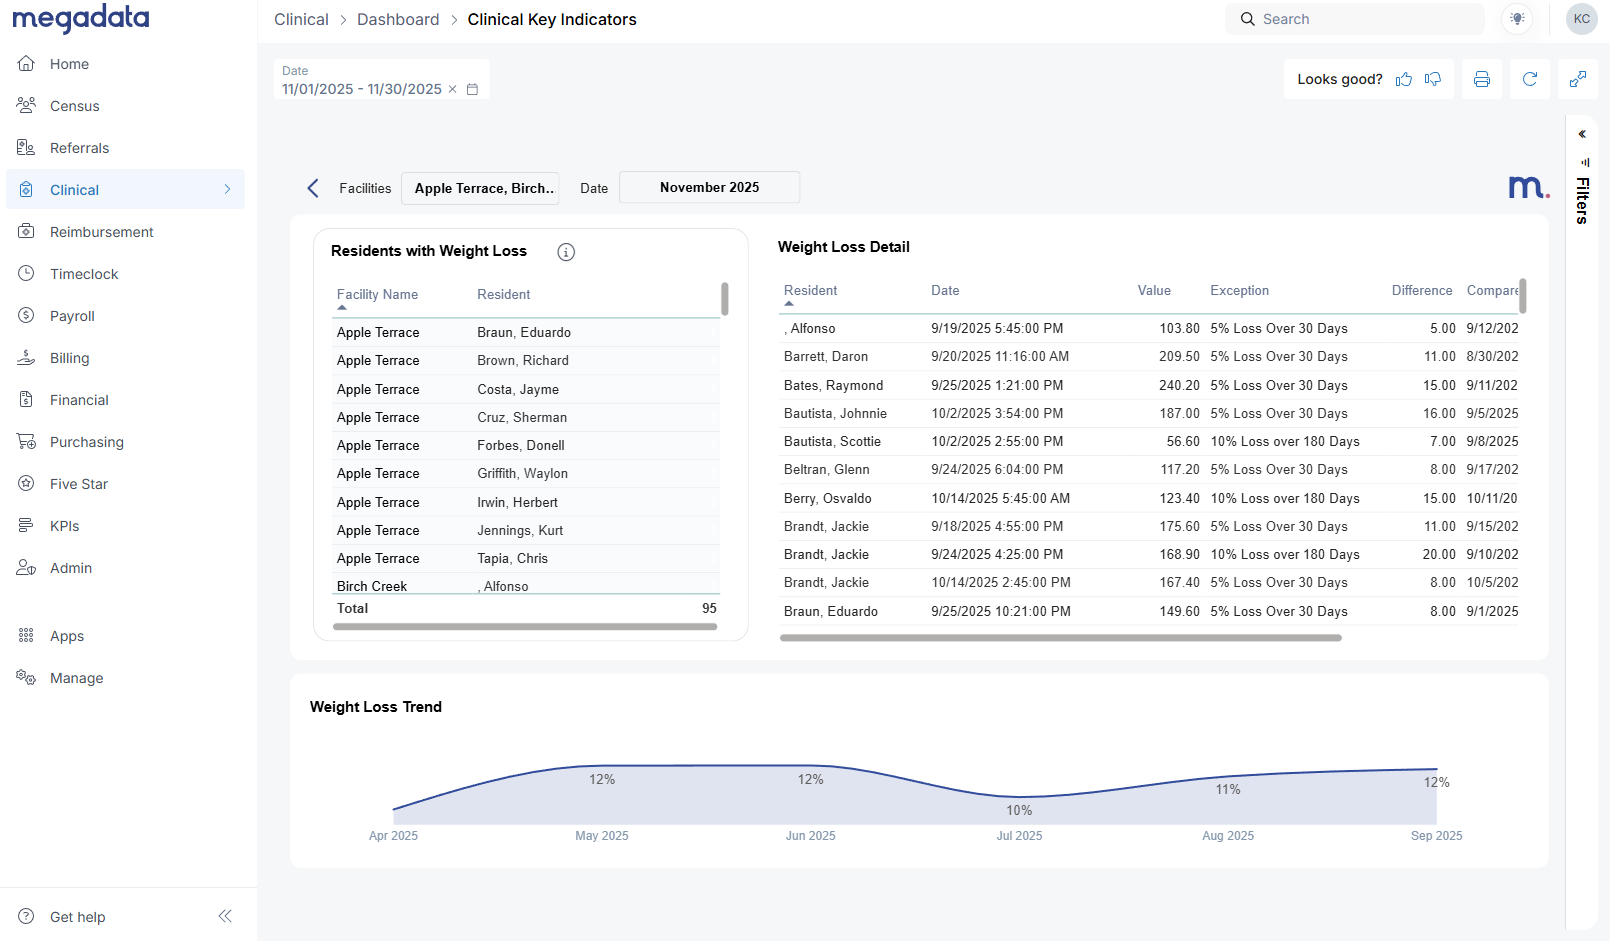
On the Detail view for weight loss, you’ll see:
- A list of residents who meet those criteria
- The percentage lost
- The comparison dates and values
Important nuance:
- If a resident is flagged for weight loss in November and then stabilizes in December (no additional loss), we don’t flag them again in December just because the prior loss is still within the time window.
- If they lose additional weight beyond that original event, they may be counted again.
This approach avoids artificially inflating your numbers with residents who had a single event and then stabilized, while still highlighting ongoing risk.
As with the psychotropics detail tables, you can:
- Filter by facility on the right side
- Export the table to Excel via the three dots menu
Planned enhancements (like an optional 7.5% weight loss parameter) are on our roadmap as we gather more input.
Detail vs Run Report: Two ways to go deeper
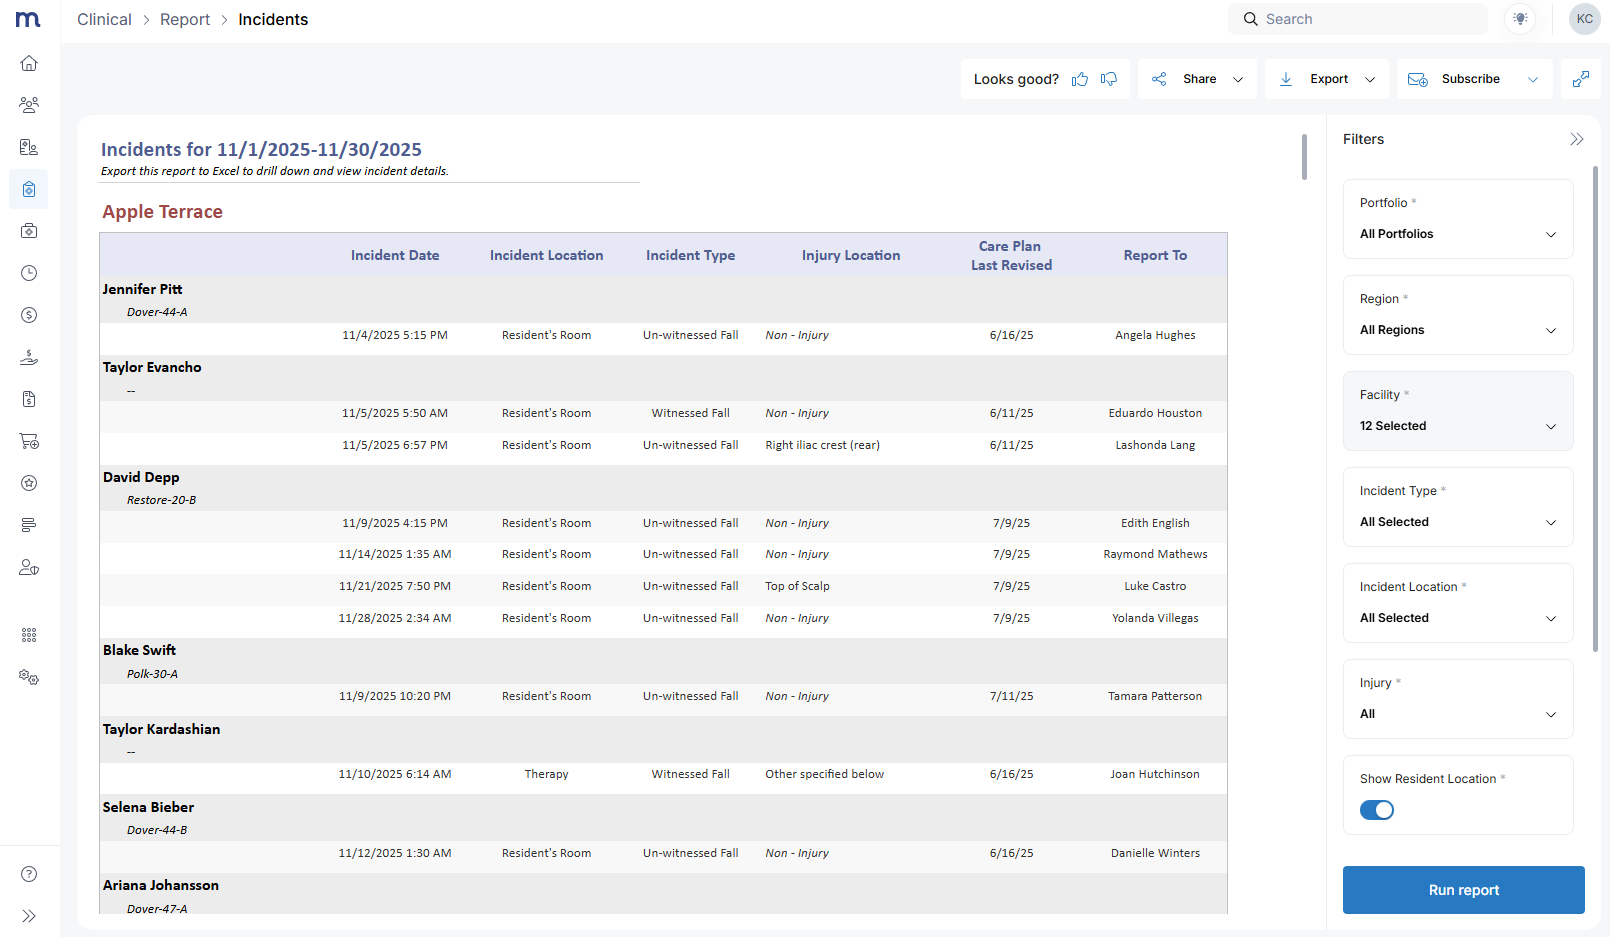
On the Clinical Indicators Dashboard, you’ll see both:
- Detail buttons (top tiles)
- Run Report buttons (bottom tiles)
They behave differently:
- Detail opens a Megadata detail view with resident-level data for that indicator (e.g., all residents with weight loss this month).
- Run Report opens a full report in a new tab—like a falls report, which shows (shown above):
- Resident
- Incident date
- Location
- Type
- Care plan information
- Whether a visitor or report was made
From the incident report, you can:
- Change parameters (facility, dates, filters)
- Export as PDF, Excel, or CSV
- Subscribe to the report as an emailed report for you and your team
This makes it easy for corporate and regional leaders to standardize reporting across facilities, while DONs and clinical managers use the same data for their internal QAPI and incident review processes.
What this means for survey readiness
These dashboards don’t replace CMS quality reporting, but they do something just as important: they shorten the feedback loop between what’s happening at the bedside and what leadership sees.
- Psychotropics tracking & reporting give you a clear, defensible process for monitoring high-risk drug classes, distinguishing schizophrenia vs non-schizophrenia residents, and cleaning up issues like long-running PRNs or discharged residents with active orders.
- The SNF Clinical Indicators Dashboard offers a real-time view of rehospitalizations, weight loss, falls, and pressure ulcers—helping you see trends early and plan interventions before they’re reflected in MDS-based quality measures.
When surveyors ask, “How do you monitor psychotropics?” or “How do you track weight loss and falls?” you can point to:
- A standardized, organization-wide dashboard
- Clear drill-downs and exported reports used in ongoing QAPI
- Real-time data pulled directly from your EHR, not just retroactive MDS reports
Ready to explore the dashboards with your own data?
If you’re already using the Megadata Clinical Module:
👉 Log into Megadata, go to the Clinical tab, and open Psychotropics and Clinical Indicators to explore the dashboards with your own data.
If you’d like help walking through these with your leadership team—or if you’re not yet a clinical module customer:
👉 Book a call with our team to see a full demo of the Clinical Module, including the new Psychotropics and Clinical Indicators Dashboards, and talk through how they can fit into your survey readiness and QAPI process.
We’re actively listening to feedback as you start using these tools. Your experience will directly shape Psychotropics v2 in 2026 and future enhancements to the Clinical Indicators Dashboard.


Similar posts


© Megadata Health Systems, Inc. All rights reserved.


🎧 New episode of Care, Code, & Capital - Listen to Grit, Recovery, and AI Trailblazing in Healthcare 🎧