Save real dollars & time with AI - Watch the Launch Recap
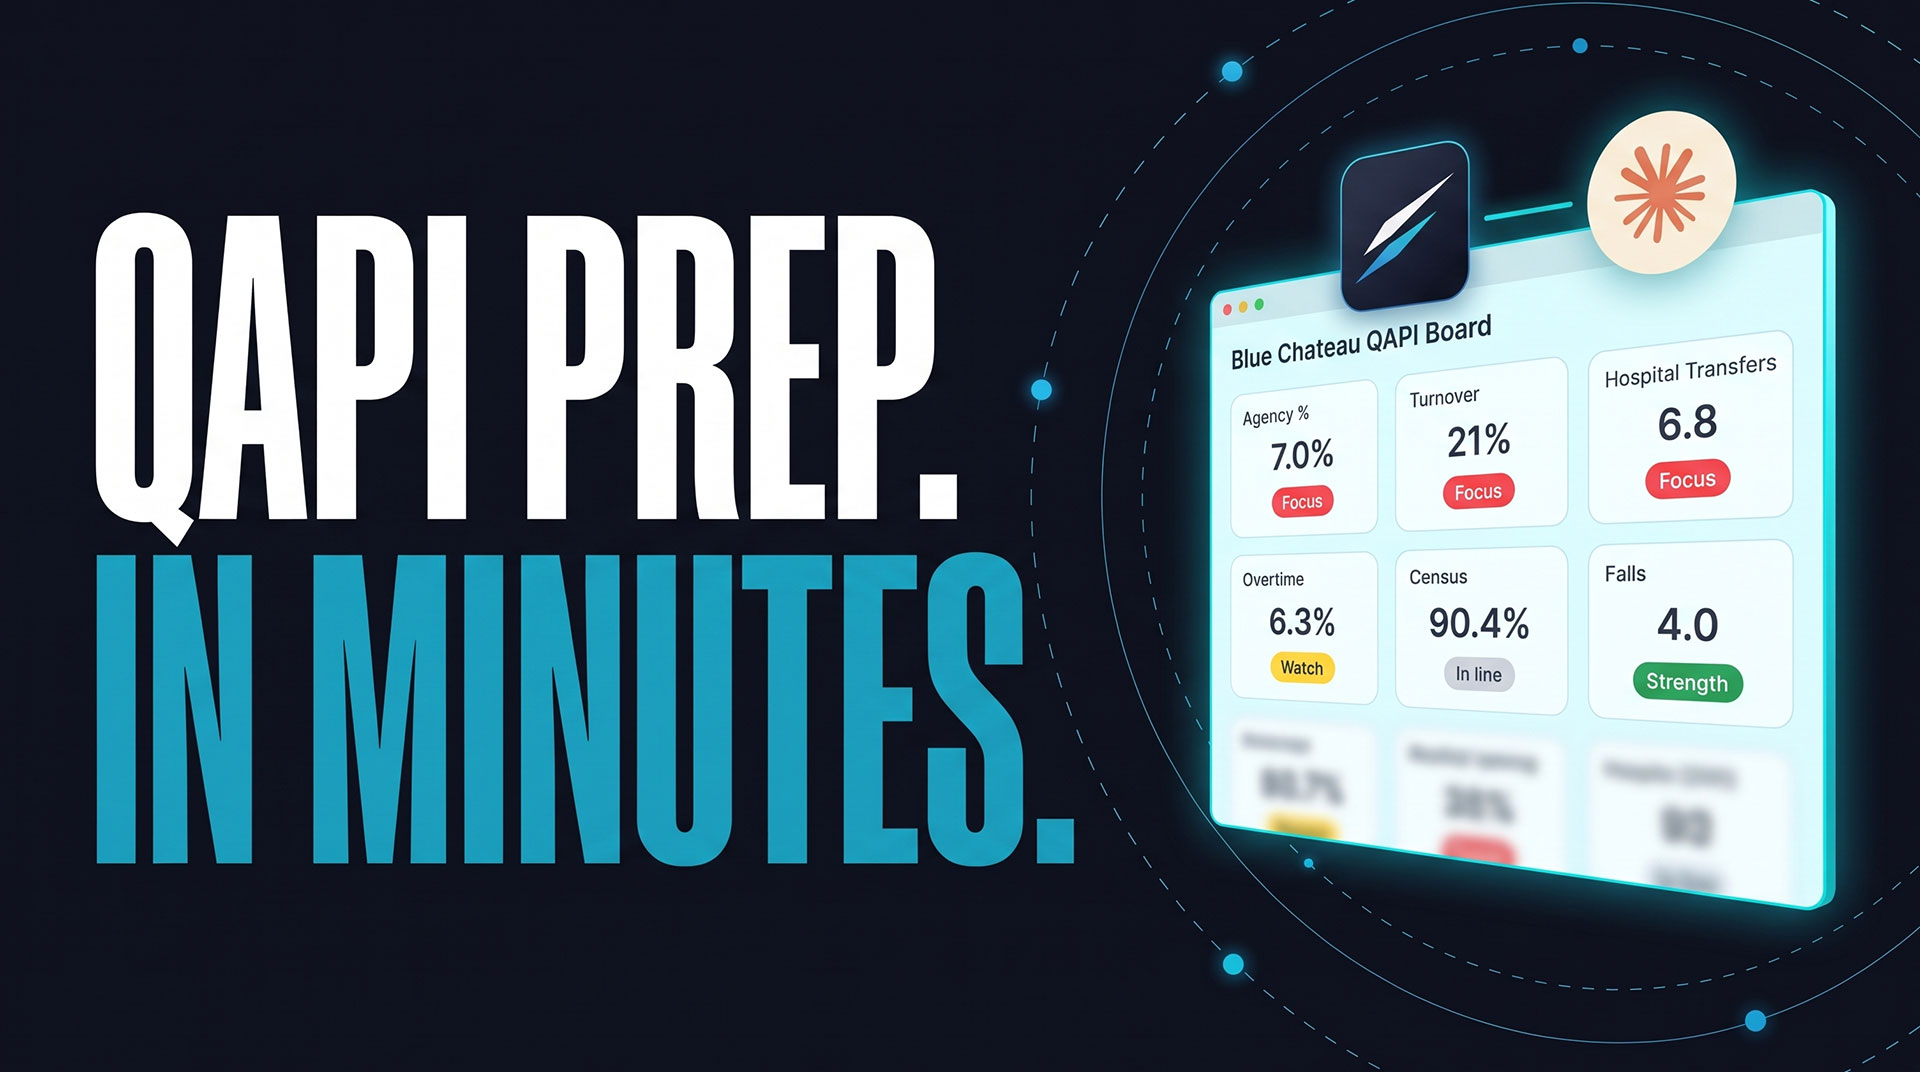
An AI QAPI meeting board is a live view of one building's quality and operations measures, built by an AI assistant from your governed data. In this example, Claude used the MegaEdge connector to pull staffing, census and clinical data from Megadata, benchmark 12 measures against the portfolio average, and rank the gaps worst first, all from one prompt.
Every administrator knows the week before a QAPI meeting. The data exists. Turning it into a clear picture of the building is the hard part. That usually means report requests, spreadsheet merges and slide building, for every building, every month.
This use case shows what changed when a user connected Claude to Megadata through the MegaEdge connector and asked for a QAPI meeting board. Claude checked what data was available, asked the questions a good analyst would ask, ran the queries and delivered a working board. The board re-runs its queries every time someone opens it.
| The build at a glance | Details |
|---|---|
| Built for | A building administrator's monthly QAPI and operations review |
| Building | Blue Chateau (Megadata demo environment) |
| Benchmark | Portfolio average across all 16 buildings |
| Data | Census, payroll time clock and clinical data in Megadata, via the MegaEdge connector in Claude |
| Live queries | 10, re-run every time the board opens |
| On the board | 12 benchmarked measures, 18 KPI tiles, 12 six-month trend charts |
| What the user typed | One prompt and three multiple-choice answers |
QAPI (Quality Assurance and Performance Improvement) is CMS's data-driven approach to quality in nursing homes. Federal rules require every facility to maintain an ongoing, data-driven QAPI program, and the quality assessment and assurance committee must meet at least quarterly. Many operators review quality monthly.
The QAPI program asks for exactly what is hardest to assemble by hand: measures from several departments, trends over time and a fair comparison point. Staffing lives in payroll and time clock data. Census lives in admissions and discharges. Falls, incidents and weight loss live in clinical records.
For one building, pulling that together takes days. For a regional director with 16 buildings, it multiplies. And by the time the slides are done, the data is already a few weeks old. It's the same problem behind the weekly KPI report, which we tackled in our walkthrough of SNF AI Use Case - filling a 10-KPI leadership report.
The whole board started from one plain-English request:
I'd like you to build me a meeting board for my facility (Blue Chateau) that covers my main concerns and tells me what to focus on using the MegaEdge connector. Make it an artifact. Ask me any questions that would help build the best meeting board before you build.
The user also attached a short context file describing a nursing home administrator's role: the departments they oversee, the information they chase and the questions they need answered. It didn't list any metrics or layout. Its only job was to put Claude in an administrator's mindset.
That was it. No metric list, no chart types, no data names, no query syntax.
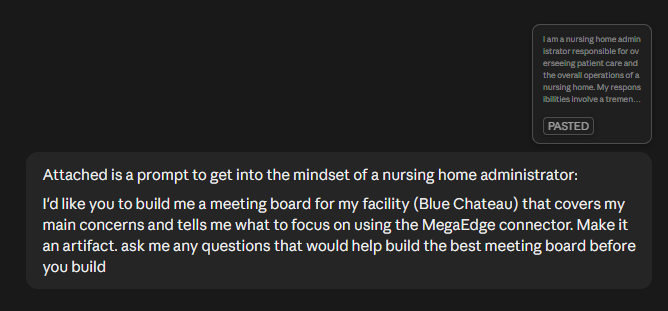
Claude worked the way a good analyst would: check what data exists, ask a few sharp questions, then build.
Step 5 is the one to notice. The goal isn't a fast answer. It's a right answer you can bring into a QAPI meeting without second-guessing it.
The board reads top-down, the way a QAPI meeting agenda usually runs: what needs attention, the full scorecard, then the detail by area.
The board opens with one sentence counting the measures that need focus, need watching or are strengths. Below it, cards show where the building is furthest behind the portfolio, worst first. Each card gives the building's value, the portfolio average, the gap and the change from last month.

One table lists all 12 benchmarked measures: the building's value, its change from last month, the portfolio average, the gap and a status of Focus, Watch, In line or Strength. Changes are colored by whether they moved the right way.
Each area has KPI tiles for the latest month and four six-month trend charts. Every chart draws the building as a solid line against a dashed portfolio average, with hover tooltips for exact values.
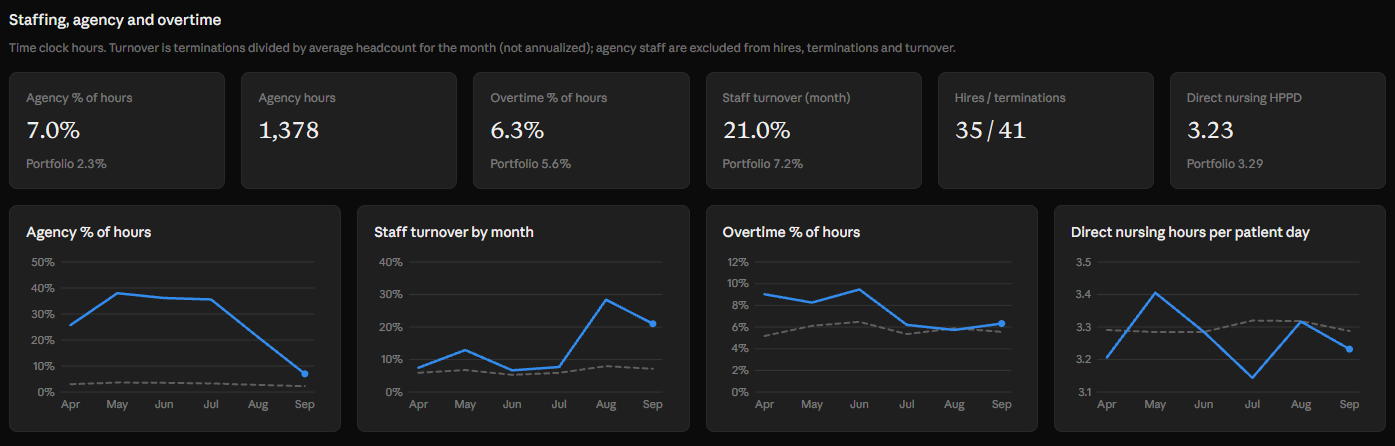
The board ends with discussion questions for each area and plain-language notes on what the data does and doesn't cover. Those questions are a ready-made starting point for the QAPI meeting agenda.
{{product-demo-call="/components"}}
Every measure is compared with one anonymized portfolio average across all 16 buildings. No other building is named, so leaders see where a building stands without the meeting turning into a building-versus-building ranking.
Claude made three choices to keep the comparison fair:
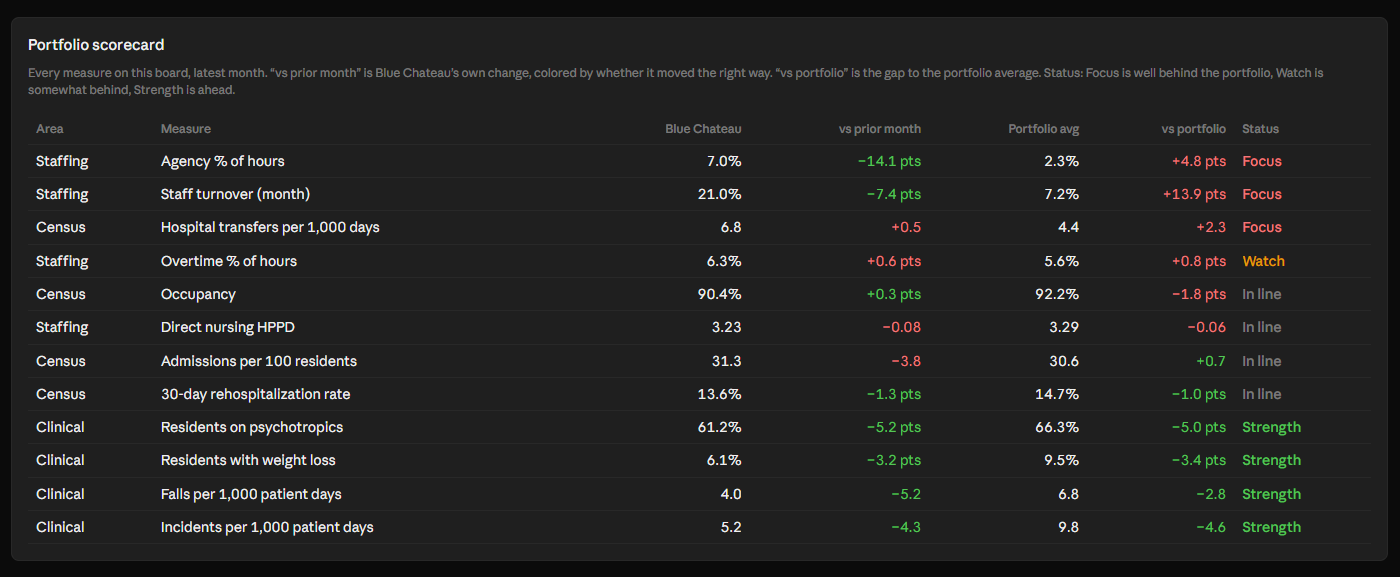
For September 2026, the board flagged staffing as Blue Chateau's clear priority: three measures need focus, one needs watching and four are strengths. (All figures come from Megadata's demo environment.)
| Measure | Blue Chateau | Portfolio avg | Status |
|---|---|---|---|
| Agency % of hours | 7.0% | 2.3% | Focus |
| Staff turnover (month) | 21.0% | 7.2% | Focus |
| Hospital transfers per 1,000 days | 6.8 | 4.4 | Focus |
| Overtime % of hours | 6.3% | 5.6% | Watch |
| Census (occupancy) | 90.4% | 92.2% | In line |
| Admissions per 100 residents | 31.3 | 30.6 | In line |
| Direct nursing HPPD | 3.23 | 3.29 | In line |
| 30-day rehospitalization rate | 13.6% | 14.7% | In line |
| Falls per 1,000 patient days | 4.0 | 6.8 | Strength |
| Incidents per 1,000 patient days | 5.2 | 9.8 | Strength |
| Residents with weight loss | 6.1% | 9.5% | Strength |
| Residents on psychotropics | 61.2% | 66.3% | Strength |
Statuses are relative to the portfolio, not clinical targets. A 61% psychotropic rate is better than the portfolio's, and still worth a clinical conversation.
The story behind the numbers is more useful than any single figure:
The user asked Claude to build a board that shows what to focus on. These specific findings came from Claude choosing the right measures, comparison and time window, then laying the gaps out for the people in the room to discuss.

The board isn't a static picture of last month. It's a live connection to Megadata, and every figure can be traced to its source.
The same prompt works for any building. Change the building name, and every administrator walks into their QAPI meeting with the same structure, benchmark and definitions.
The connector is available in Claude now, with ChatGPT coming soon. For the full story of what launched, read the MegaEdge launch recap.
If you are an existing Megadata customer, you can try MegaEdge for free for 30 days, including the AI Connector to Claude. Just reach out to us via our Contact Us form to let us know you would like to get started.
Once you connect Claude through the MegaEdge connector, then copy this prompt and fill in the brackets:
I'd like you to build me a meeting board for [building name] that covers my main concerns and tells me what to focus on using the MegaEdge connector. Make it an artifact. Ask me any questions that would help build the best meeting board before you build.
Tips for a better board:
A QAPI meeting reviews the building's quality and performance data, identifies gaps and tracks improvement projects. Most cover clinical outcomes like falls, incidents, weight loss and rehospitalizations, alongside staffing and census, since those drive quality. A board that benchmarks each measure and shows six-month trends keeps the discussion on what changed and why.
Federal rules require the quality assessment and assurance committee to meet at least quarterly. Many operators review quality data monthly so problems don't sit for a full quarter. A live board that refreshes on open makes a monthly cadence easier, because no one has to rebuild the report each time.
Yes. With Claude connected to Megadata through the MegaEdge connector, one prompt produced a live QAPI board with 12 benchmarked measures and 12 trend charts. The MegaEdge Engine routes each question to Megadata's validated measures, so the numbers match the definitions your team already uses.
No. In this example, every figure is a building-level or portfolio-level total. Access also follows each viewer's Megadata permissions, so people only see data for the buildings they already have access to.
Yes. It re-runs its queries every time it opens, and the reporting month and six-month trend window move forward automatically. Next month's meeting uses the same board with current data.
The connector is available in Claude today. ChatGPT support is coming soon.
A QAPI program depends on good data, reviewed on a steady rhythm. The hard part has never been the meeting. It's the days of assembly before it.
There are so many SNF AI use cases for Claude. In this example, one prompt and three answers produced a live QAPI meeting board for Blue Chateau. It was benchmarked fairly, honest about its gaps and ready to refresh for next month. The same prompt works for every building in the portfolio.
Already a Megadata customer? Your data is connected, so you can try MegaEdge with a free trial. New to Megadata? Book a 20-minute walkthrough and see how AI for SNF can change your next QAPI meeting.